Documentation
Complete guides and documentation for IPTRADE software - everything you need to get started and make the most of your trading experience.
Updated to latest version on August 29, 2026
Table of Contents
- Introduction
- System requirements
- Installation and demo
- Trade copier configuration
- Trading dashboards
- Analytical statistics reference
- How a trade counts (win / loss / break-even)
- IPTRADE Score
- Profit & loss (P&L)
- Win-rate metrics
- Risk-adjusted ratios
- Drawdown
- Edge & advanced metrics
- Streaks and Z-score
- Daily and per-period metrics
- Costs and holding times
- Long vs Short and symbol breakdowns
- Calendar cell metrics
- Analyze view dimensions and metrics
- Troubleshooting
- FAQ
- Support
Introduction
IPTRADE is trade copying software that replicates trades between multiple accounts in real time. It runs entirely on your machine—no cloud, no middleman. You get one IP for all accounts, full control, and zero exposure of your data. Built by IPTRADE COPIER LLC for traders who need reliability, speed, full control and prop-firm compliance.
What it does
You set one account as Master (the source) and others as Slaves (the copiers). Every open, modify, and close is mirrored across connected accounts with zero added latency (TCP on your machine). No manual re-entry, no missed trades. Ideal for running the same strategy on several brokers, scaling prop firm passes, or mirroring a personal account to funded accounts.
Features
- Cross-platform copying — Copy between MetaTrader 4, MetaTrader 5, and cTrader in one app. Master on MT5, slaves on cTrader or MT4—all supported (on Windows you get MT4 and MT5 via bot, plus cTrader; on macOS, cTrader).
- Bot-based connection — Lightweight bots run inside your MetaTrader terminals and talk to the IPTRADE app. No VPS required for the app itself; you can still use a Windows VPS for 24/7 copying.
- Symbol translation — Different brokers, different ticker names. Map symbols (e.g. EURUSD → EURUSD.a), add/remove prefix or suffix, so slaves always trade the correct instrument.
- Flexible sizing — Use a multiplier (e.g. 1.5× master volume) or fixed lot (e.g. 0.01 on every copy). Suits prop rules and risk preferences.
- Reverse trading — Invert direction (buy↔sell, limit↔stop, SL↔TP) for hedging or inverse strategies.
Benefits
- Single IP for all accounts — All copies originate from the same machine (and thus same public IP). Prop firms see one consistent IP; no multi-IP or “different location” issues.
- Privacy and control — Everything runs locally. No trade or account data is sent to external servers. Your edge and history stay on your side.
- Speed — Zero added latency. TCP communication on your machine, no round-trip to a remote server. Copies execute as fast as your platform and broker allow.
- One app, multiple platforms, unlimited connections — One free app, one dashboard and unlimited account connections. Manage MT4, MT5, and cTrader connections and configurations from a single place.
Use cases
- Prop firm scaling — Run one strategy across multiple funded accounts (same or different brokers) with one IP and consistent risk (e.g. fixed lot per account).
- Multi-broker redundancy — Same signals on several brokers for execution diversity or backup.
- Personal + funded — Trade your own account as Master and mirror to prop/funded Slaves with adjusted lot sizes.
- Copy services / signal providers — Use your Master as the source and connect client Slaves with their own sizing and symbols.
- Your own copy trading server — Set up IPTRADE on a VPS (any Windows VPS works) to run 24/7 with all your accounts connected. No need to keep your PC on—your copy trading server runs around the clock, copying trades automatically.
For technical requirements, installation steps, and configuration details, use the sections below.
System requirements
Minimum
- OS: Windows 10/11 64-bit or macOS Apple Silicon ARM64
- RAM: 8 GB
- Disk: 2 GB free
- Network: Stable internet
Platforms
- Windows: MetaTrader 4, MetaTrader 5 (via Expert Advisor), cTrader
- macOS: cTrader
Windows vs macOS: On macOS, IPTRADE supports cTrader only. MetaTrader 4 and MetaTrader 5 use the Windows terminal integration (EAs, DLLs, process model), so those platforms are Windows-only.
VPS: You can run IPTRADE Multi on a Windows VPS for 24/7 operation.
Installation and demo
Step 1: Download and install the app
- Download the latest IPTRADE Multi installer for your OS (Windows .exe or macOS .pkg). The link will provide the correct version for your system.
- Run the installer and follow the wizard (about 1 minute).
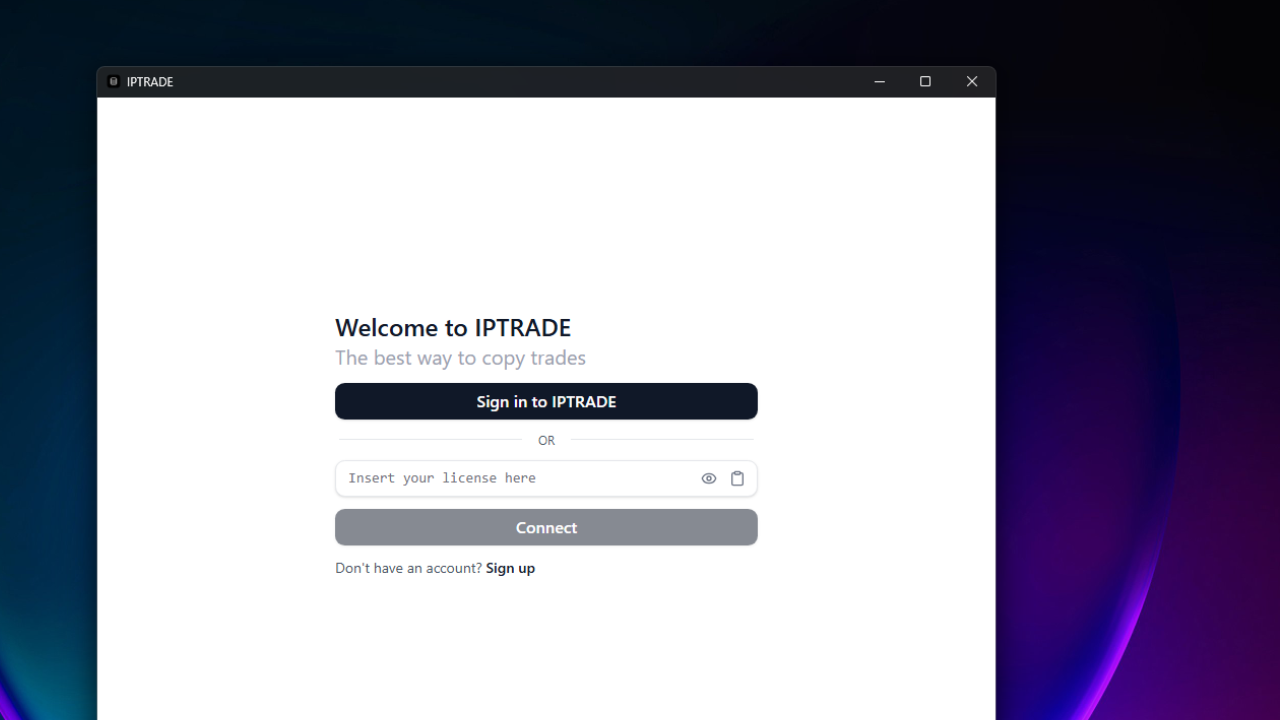
- Open the app — no account or sign-in required, IPTRADE Multi is 100% free.
When you open the app, depending on your operating system, you will see different setup options:
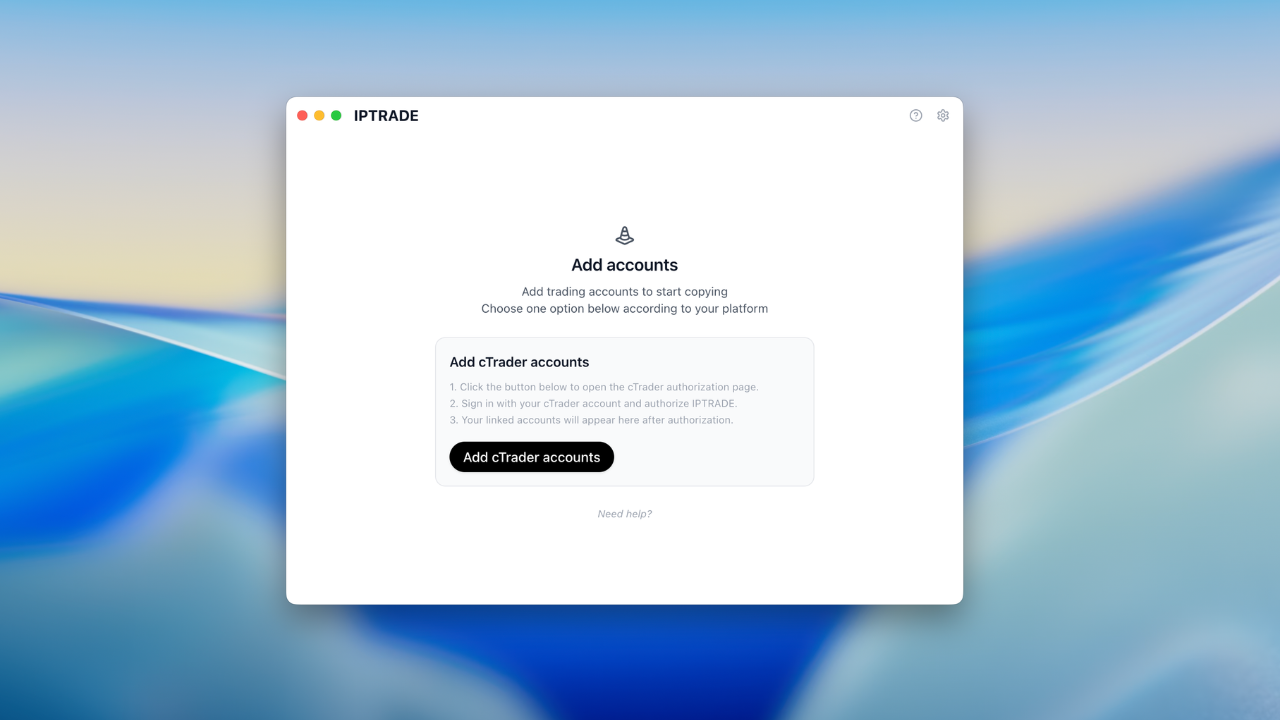
- macOS: Supports cTrader only. You will see the option to add cTrader accounts.
- Windows: Supports cTrader and MetaTrader 4 and 5 via Expert Advisor. You will see cTrader and installation options for MetaTrader bots.
Set up MetaTrader accounts via Expert Advisor
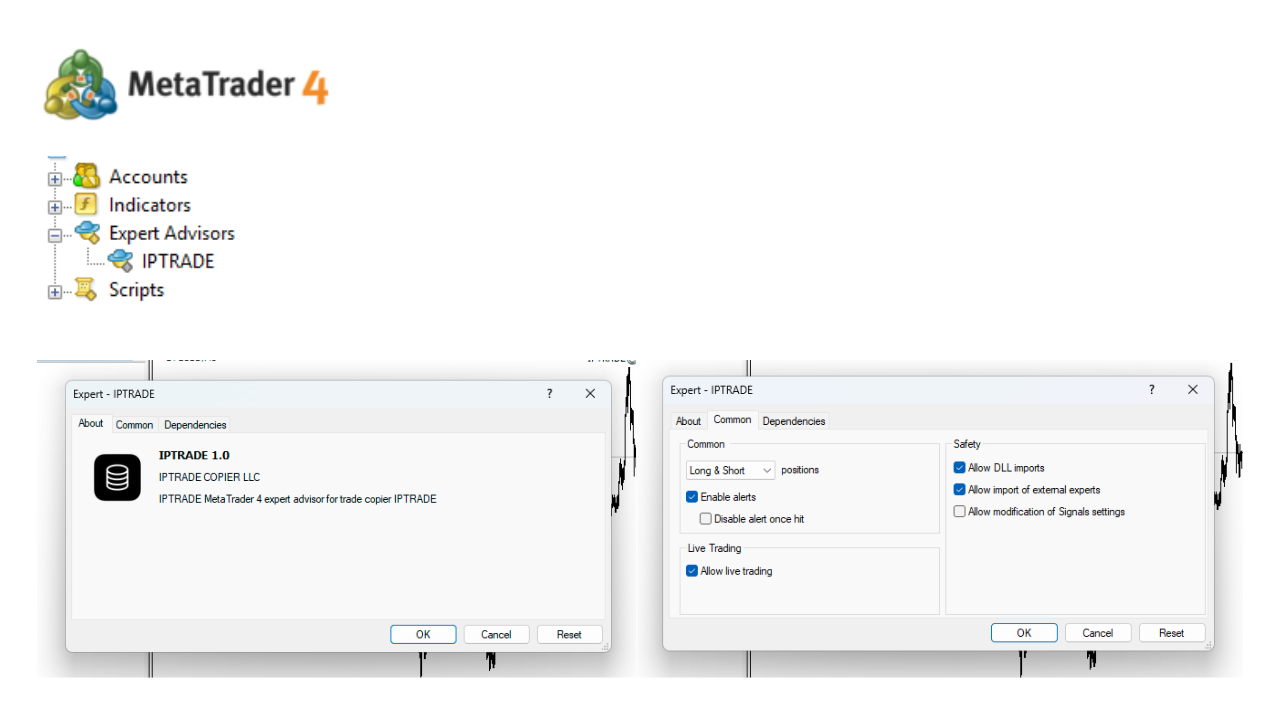
MetaTrader 4 and MetaTrader 5 accounts connect to IPTRADE through the IPTRADE Expert Advisor (bot), which runs inside the MetaTrader terminal and talks to the app. MetaTrader must be installed and open for the bot to operate.
- In the IPTRADE app, click Install bots to install the IPTRADE bot on your trading platform. If MetaTrader is already open, close and reopen it (or refresh) so the bot loads.
- Add the IPTRADE bot to a chart on each platform.
- Allow DLL imports, automated trading, and live trading when prompted.
- Wait for the MetaTrader accounts to appear in the IPTRADE app.
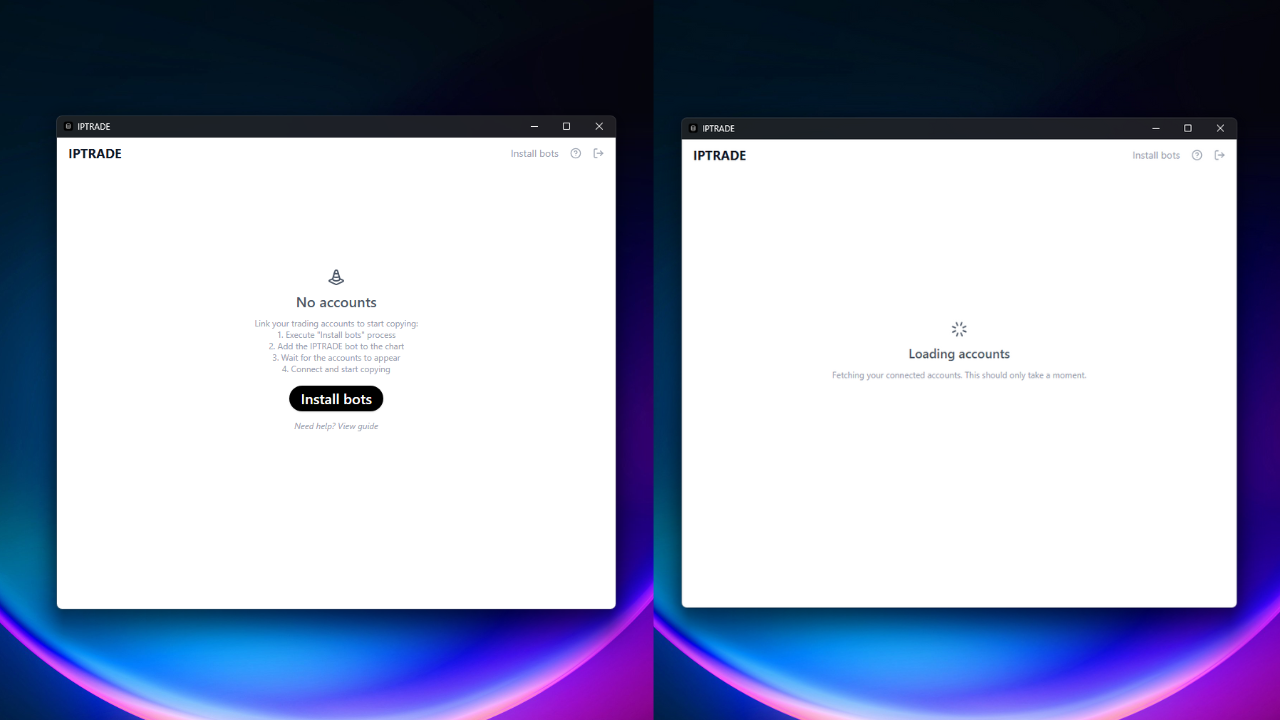
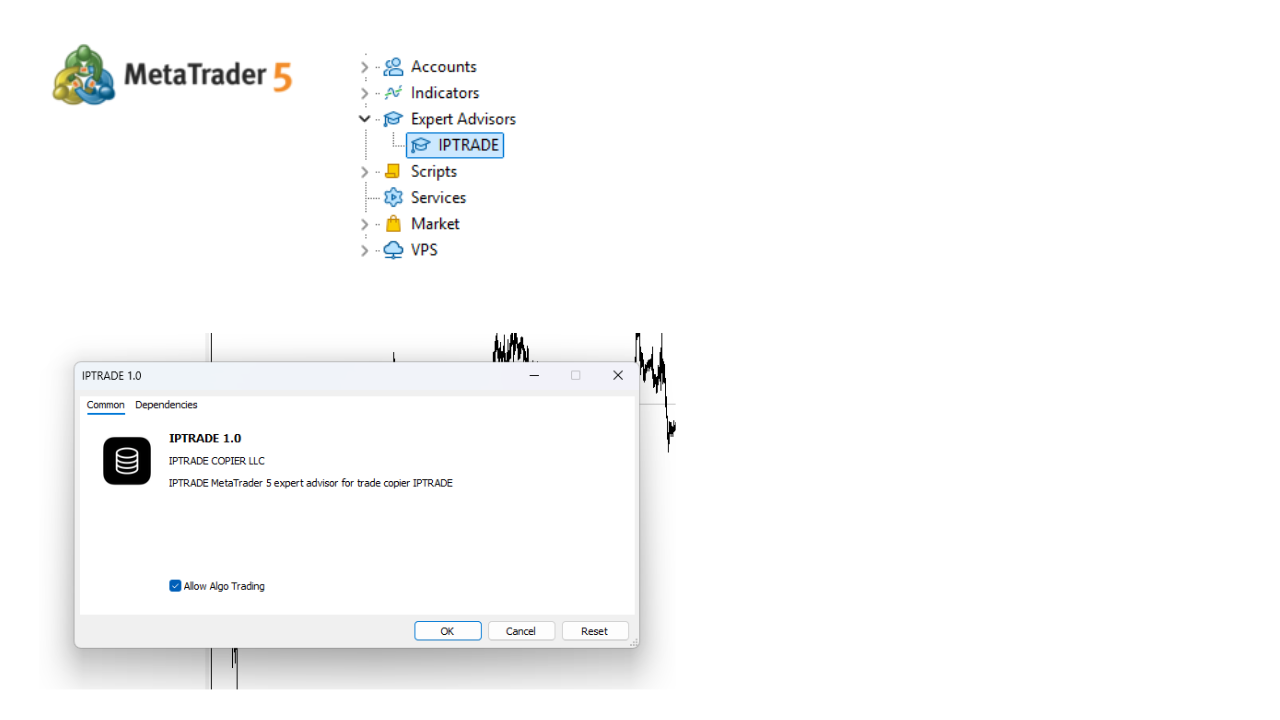
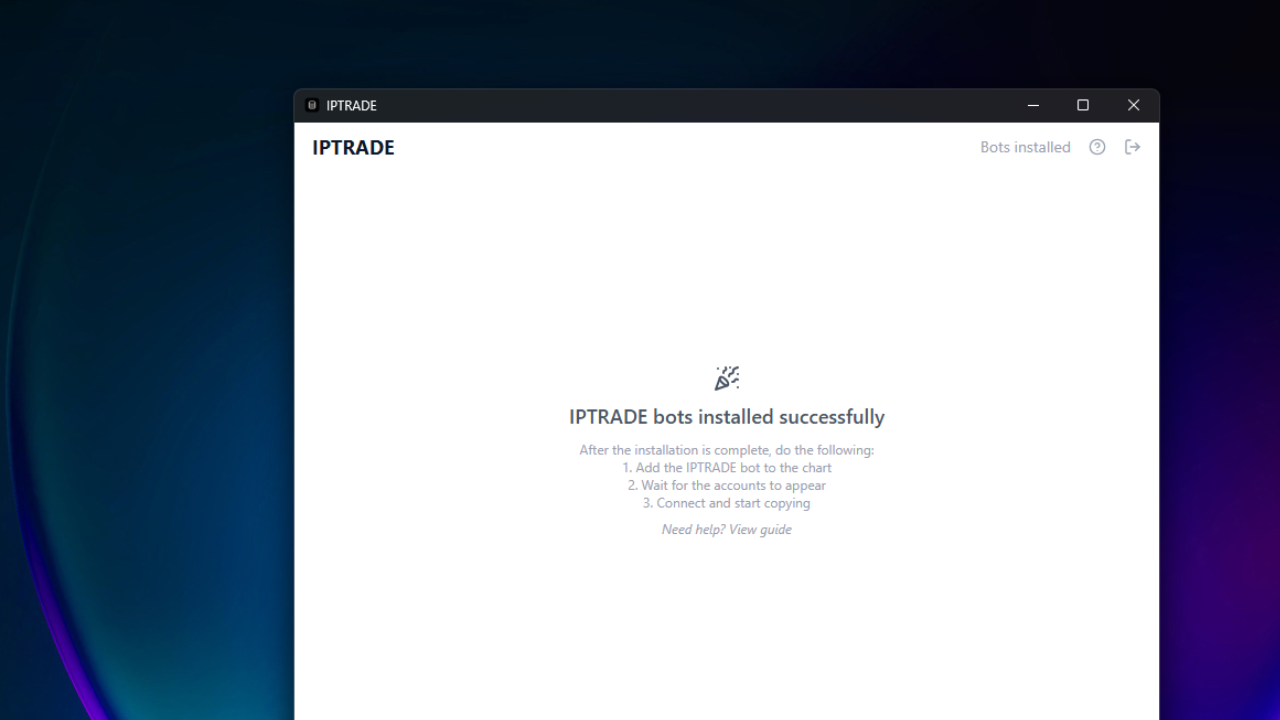
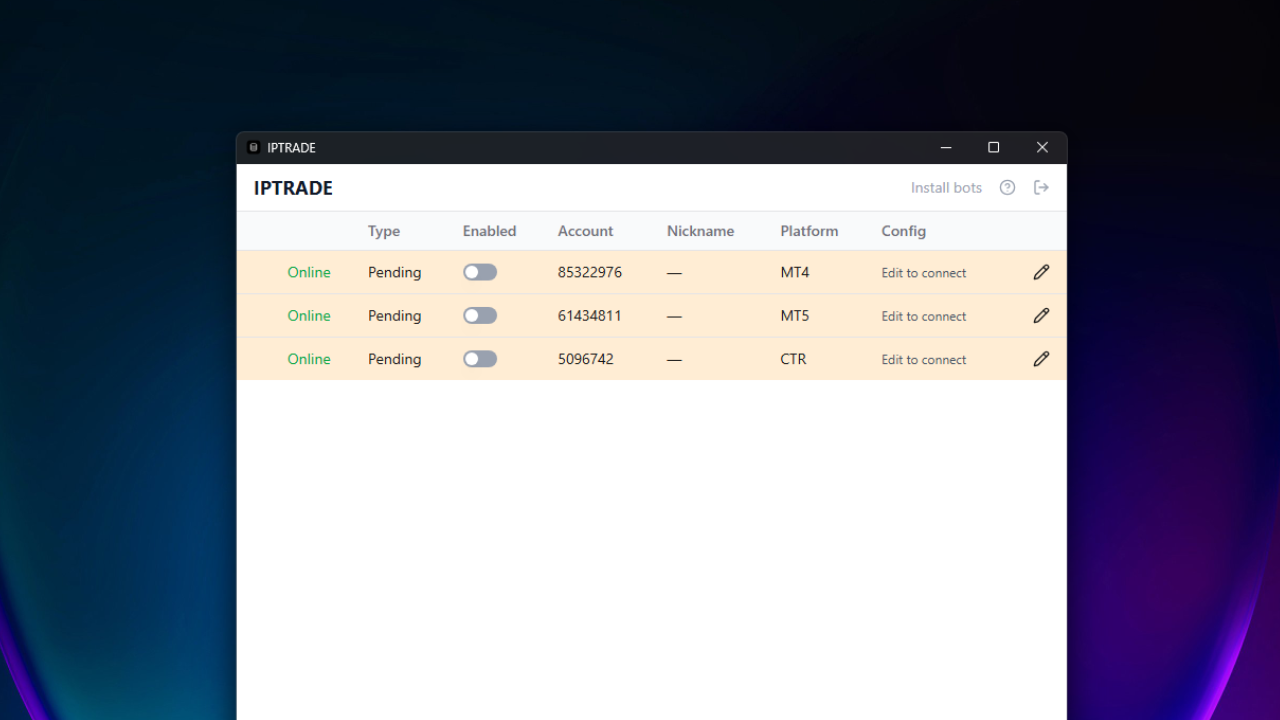
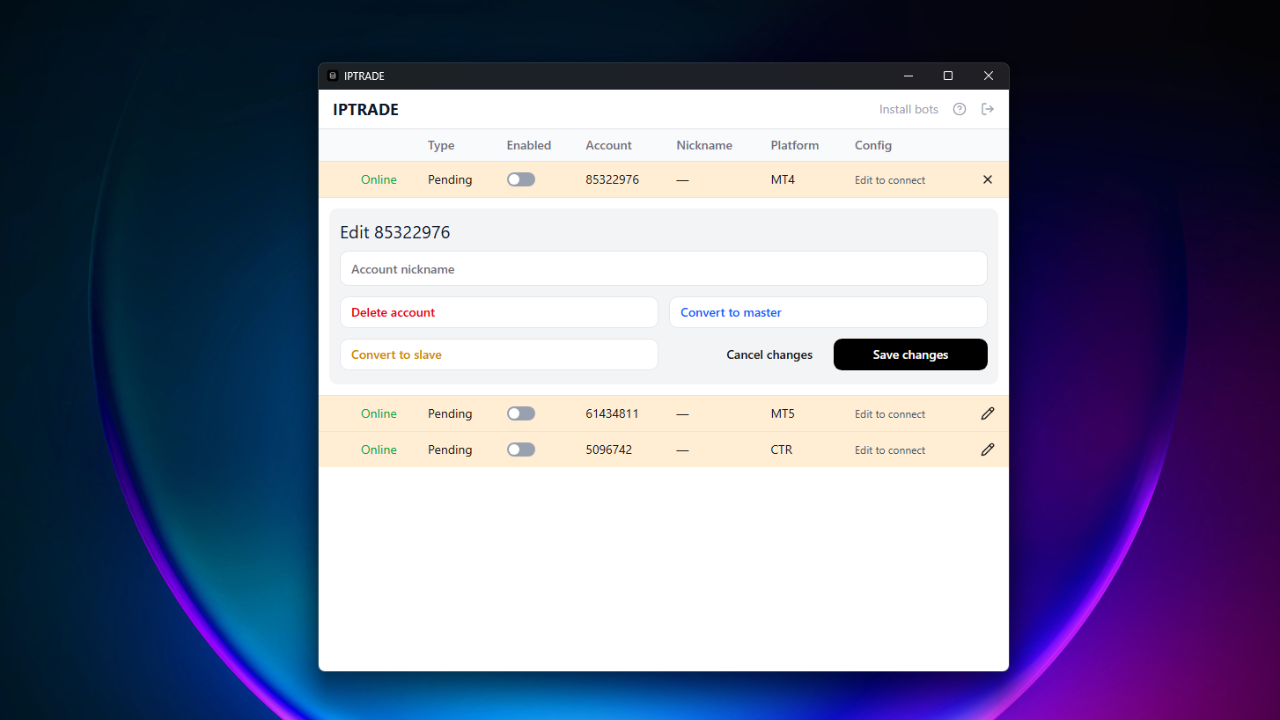
Accounts appear as Pending to configure when linked to the app.
Set up cTrader accounts
- In the IPTRADE app, click Add cTrader accounts to open the cTrader authorization page in your browser.
- Select the accounts you want to add and click Allow.
- You will then be redirected to the app; it will receive your account data and add your cTrader accounts as Pending, ready to configure.
Step 2: Configure and start trading
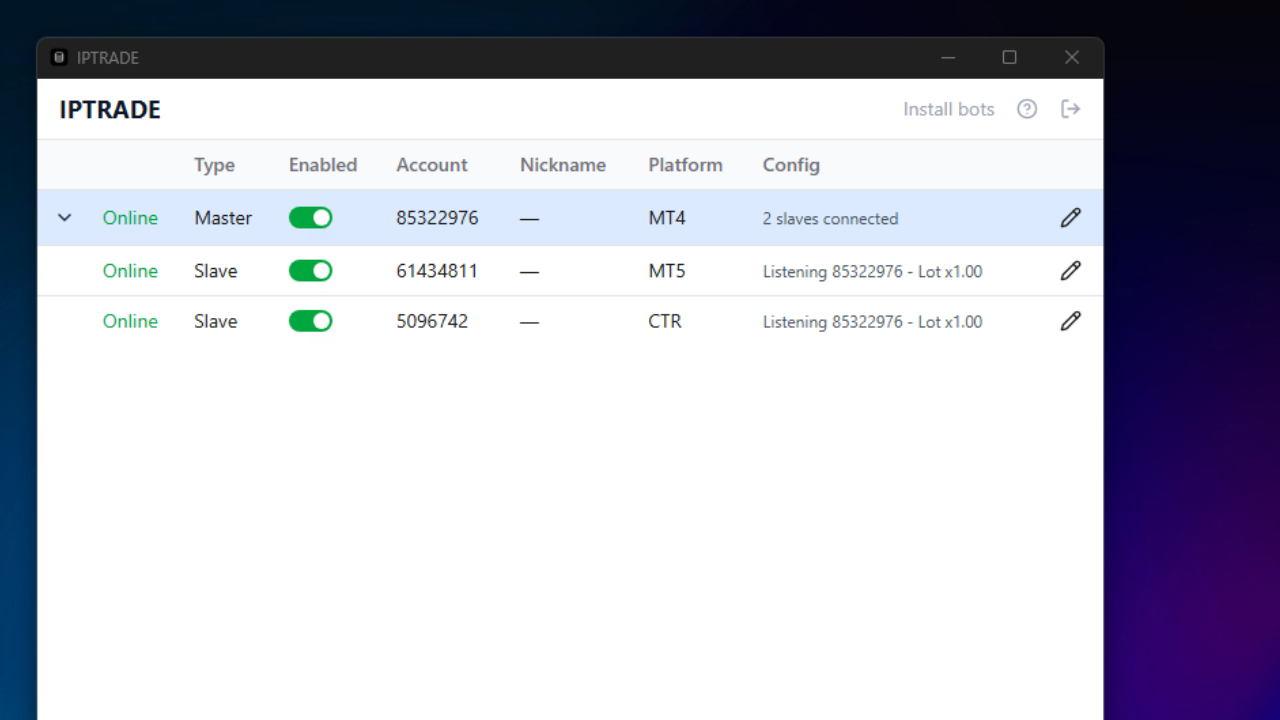
- Edit the pending account, convert it to Master or Slave, and set the options you need.
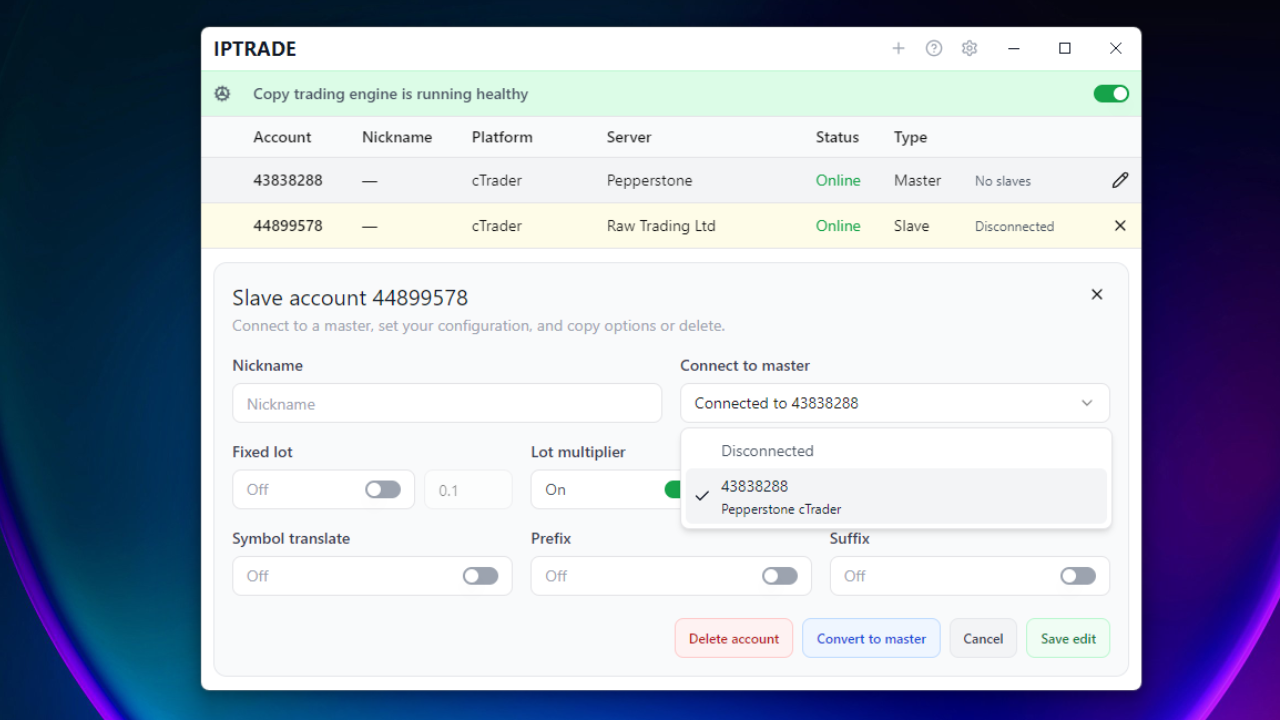
- Once configured, start copying. For more options, see Trade copier configuration.
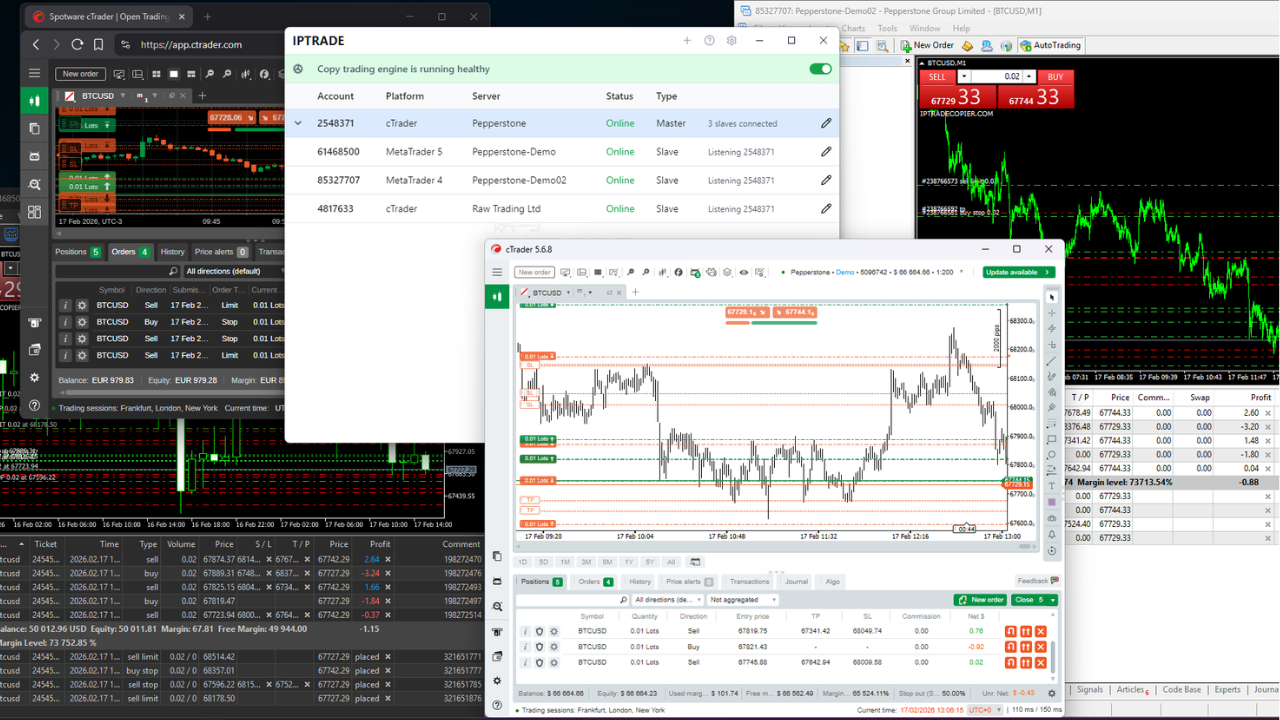
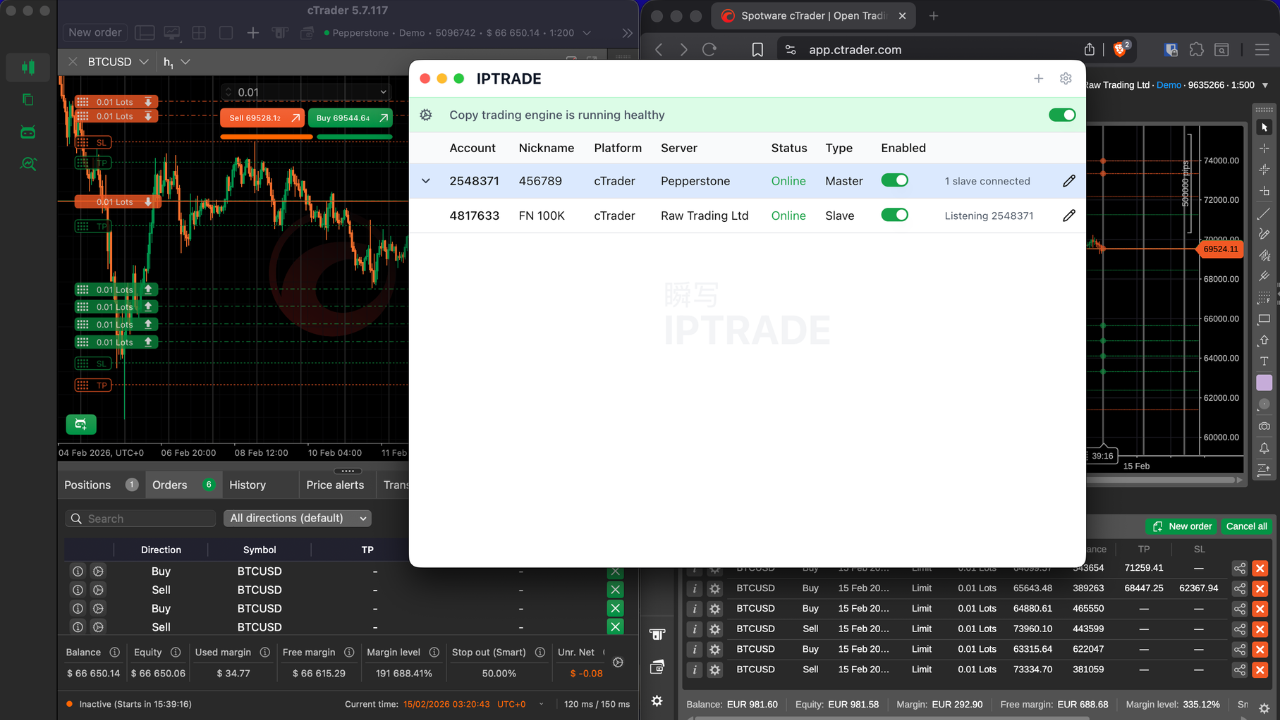
Trade copier configuration
Applies to IPTRADE Multi.
Account types
- Pending — Newly connected; inactive until you set Master/Slave and options.
- Master — Sends its trades to slaves.
- Slave — Copies from a chosen master.
Basic flow
- Connect the account (bot on platform) → it appears as Pending.
- Set type: Master or Slave (pick master to follow) and configure options.
- Turn the Copy Engine ON (global toggle) to start copying. When it’s OFF, no copy actions run.
Copy engine (global on/off)
The Copy Engine toggle (top banner) is the only on/off control: it starts or stops the whole copy engine.
- ON — Copying runs as configured for all connected Master/Slave pairs.
- OFF — No copy actions run; all copying is paused regardless of connection state.
Use it to pause or resume all copying without changing account settings.
Connection state
- Online / Offline / Pending: Whether the bot is connected to the app. Status updates come from the bot; if the app doesn’t get a connection for ~30 seconds, the account shows Offline.
- Offline = can’t copy (no connection). Copying only runs when the account is Online and the Copy Engine is ON.
Slave options
Master to follow — Choose the master account. "None" = slave inactive.
Size mode
- Multiplier — Volume = master volume × multiplier.
- Fixed lot — Use the lot size you set.
Symbols
- Symbol translation — Map different symbols between brokers (e.g. EURUSD ↔ EURUSD.a).
- Prefix / suffix — Add or remove text (add/remove mode). Example: suffix remove ".a" if the broker uses "EURUSD.a".
Reverse trading — Inverts buy/sell, limit/stop, and SL/TP. Orders below 0.01 lot are not sent.
Exact match — For slave accounts only. When enabled, the copier keeps the slave aligned with the master: trades on the slave that are not part of the active copy are closed during reconciliation, so manual or leftover positions are not left open alongside copied trades. Leave it off if you need to keep other trades on the same account.
Configuration
You can customize the app interface and trading display from Configuration (gear icon). Each option can be shown or hidden with a toggle.
Interface
- CPU / RAM info — Show or hide the total system consumption (RAM and CPU) of your machine. Useful to monitor usage; disable for a cleaner interface.
- Open trades in header — Show or hide the open trades counter in the app header. When enabled, you can see at a glance how many positions are currently open across all connected accounts.
- Connection sounds — Enable or disable sounds when accounts connect or disconnect. Useful for staying aware of connection changes without watching the screen.
Columns
- Nickname — Show or hide the nickname column in the account list. Useful when you use nicknames to identify accounts; hide for a more compact view.
- Balance — Show or hide the balance column in the account list. When enabled, you see each account's balance at a glance.
- Equity — Show or hide the equity column in the account list. Equity reflects the current account value including open floating PnL.
- PnL — Show or hide the Profit and Loss column. When enabled, you see unrealized PnL per account.
- Open orders — Show or hide the open orders column in the account list.
- Slave config — Show or hide the column that displays the slave configuration (size mode, multiplier or fixed lot, symbol translation, reverse trading, exact match, etc.).
- Always show columns — When enabled, all columns are always visible regardless of window size. When disabled, some columns may be hidden automatically on smaller windows to save space.
Clear all data
The Clear all data button (bottom of Configuration) wipes every local preference and connected-account record stored by IPTRADE on this machine: accounts, master/slave configurations, nicknames, customizer layouts (Statistics, Calendar, History, Analyze) and interface toggles. Use it to start from a clean slate. The action is local and immediate — nothing is sent anywhere — but it cannot be undone, so you'll need to re-add and re-configure your accounts afterward.
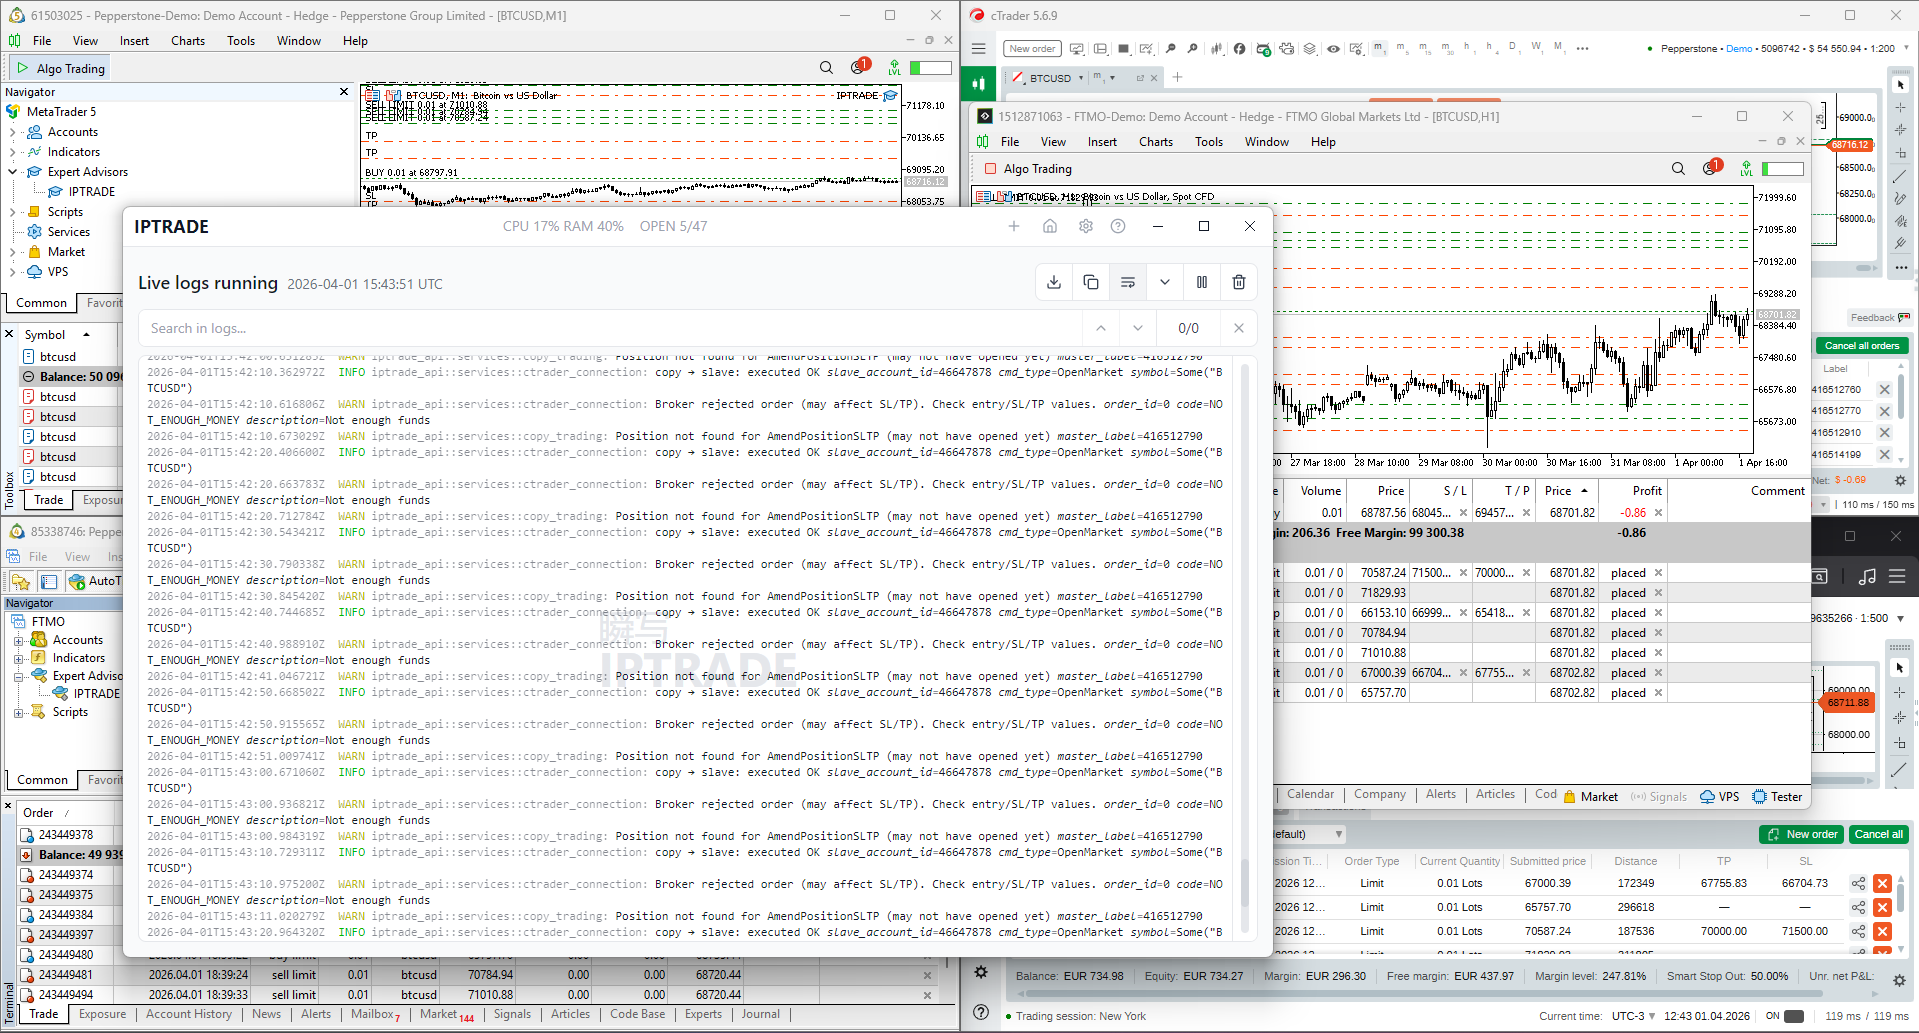
Logs
- View live logs — Opens a screen where application logs are shown in real time (executions, connections, errors). Helps you see what the app is doing and, if something fails, where it failed; also useful for support when reporting an issue.
- Download logs — Download the application logs to your machine.
- Clear logs — Clear the current logs.
Trading dashboards
Beyond the copy trading panel, IPTRADE Multi includes four trading dashboards built on top of your connected accounts: Terminal (live open and pending orders), Calendar (daily / weekly / monthly P&L grid), Statistics (full analytics dashboard) and History (closed trades). A fifth view — Analyze — is a pivot table that can be opened from the header on top of any of the history-related views.
All four views share the same filter header (period selector, account filter, refresh, customize) and the same underlying data, so a change to the date range or account selection in one view follows you to the others. Customizations (column order, visible metrics, sort) are persisted per view in your browser/app local storage.
Shared controls (period, accounts, customize, refresh)
The header bar above the Calendar, Statistics, History and Analyze views exposes the same set of controls. They all act on the same underlying filter, so flipping one applies it across views.
- Granularity toggle (Calendar / Statistics / History only) — switch between Month, Quarter and Year. The granularity drives the Calendar layout (days, weeks, months), and it pre-defines the period range used everywhere else.
- Previous / period label / Next — step the active period one step at a time (← previous month/quarter/year, → next, capped at the current period). The center label opens a quick picker (12 months, 4 quarters, or the last 12 years) for jumping directly.
- Date range picker (Statistics, History, Analyze) — a free-form day/month/year picker. Click the start day, then the end day; the range is applied immediately. You can drill into months or years from the same dropdown.
- Today — shortcut button shown only when the visible period (or selected range, on Analyze) does not include today; clicking it jumps back to the current period.
- Period stats strip — when enough room is available, the header shows a quick read-out of the active period: Trading days, Trades, and Period total (Month / Quarter / Year total). On narrow windows the strip auto-collapses, keeping the rightmost item (the total) visible last.
- Account filter — multi-select dropdown of every connected account. "All accounts" is the default; pick one or several to scope all dashboards. Mark accounts as favorites with the star icon — favorites float to the top of the list and persist across sessions.
- Analyze toggle (grid icon) — switch between the current view and the Analyze pivot table. Toggling back returns to the previous (non-Analyze) view, so it acts as a "popout" rather than a permanent change.
- Customize (gear icon) — opens the customizer for the active view. The icon only appears on views that have customization (Statistics, Calendar, History).
- Export CSV (History only, download icon) — exports the currently filtered closed-trades list to a CSV file. Filename includes the active period.
- Refresh — forces a reload of trades and account data. The icon spins while a refresh is in progress.
Customizing columns, cells and section order
Every dashboard surface that has its own customizer follows the same idea: each item (a chart section, a calendar metric, a table column) can be toggled visible/hidden and dragged to reorder.
- Statistics customizer — toggles entire sections of the dashboard (Hero KPIs, IPTRADE Score & equity curve, Win rate & key ratios, Advanced metrics, Daily P&L, Drawdown & distribution, Trade duration, Time patterns, Heatmap, Long/Short + symbols, Bottom symbols + volume mix, Daily activity calendar, Costs footer). Drag the grip handle to reorder, click the eye icon to hide. Reset returns the layout to the default.
- Calendar customizer — picks which metrics each cell renders and in what order: Net P&L, Trade count, Win rate, Best trade, Worst trade, Volume, Avg P&L per trade. Up to four metrics can be shown per cell at once; the first visible one is rendered as the headline (large) value.
- History (orders) customizer — toggles columns (Account ID, Platform, Server, Nickname, Symbol, Side, Volume, Open, Close, SL, TP, Open time, Close time, Commission, Swap, PnL, Net PnL, Ticket) and reorders them. Columns can also be reordered directly from the table by dragging the header grip handle that appears on hover, and clicking a header cycles its sort: ascending → descending → unsorted.
All preferences are stored locally and only affect your installation; nothing is sent to a server.
Terminal screen
The Terminal is the live view of every position and pending order across your connected accounts in one table. It is the operational, "what's open right now" view — separate from history.
- What it shows — Two stacked sections in one table. The top section lists open positions (filled trades currently in the market) and the bottom section lists pending orders (limit / stop orders not yet triggered). Both are sorted by ticket and account.
- Columns — Account ID, Platform, Server, Nickname, Symbol, Type (side for open positions; side + order type for pending), Volume, Price (open price for positions; trigger price for pending), Open time, SL, TP, PnL (open positions only — pending shows "—"), Ticket.
- Auto-fit columns — Columns auto-hide as the window narrows, in a fixed priority (least important first: Server, Platform, Nickname, Open time, SL, TP, Ticket, Price, Account ID). Symbol, Type, Volume and PnL always stay visible. This keeps the table readable on small windows without horizontal scrolling.
- Live PnL & totals row — A sticky footer between open positions and pending shows aggregated Balance, Equity and PnL across every open position (sum of each connected account's reported values). PnL is colored green when positive, red when negative. Values stream in live from the bots and cTrader connections.
- No-data states — If you have no accounts connected, the screen prompts to add accounts. If accounts are connected but no positions or pending orders exist, an empty state is shown.
Calendar screen
The Calendar gives you a P&L heatmap of your trading by day, week, month, quarter or year, depending on the selected granularity.
- Month view — A 7-column grid (Sunday → Saturday) with one row per week of the month, plus an extra Summary column on the right that shows the week total. Each cell is a day with the configured metrics rendered (default: Net P&L + trade count). Cells are tinted green when the day is profitable, red when it's negative, gray when there were no trades. Days outside the current month are dimmed.
- Quarter view — Each row is a month of the quarter; each cell is a week of that month. The right-hand summary column shows the month total. Clicking a week zooms into the Month view for that week's date range.
- Year view — A 4-column grid with one row per quarter; each cell is a month, and the rightmost column is the quarter total. Clicking a month zooms into the Month view for that month, clicking a quarter into the Quarter view.
- Cell interactions — Clicking the body of a cell opens that day/week/month in the History (orders) view filtered to that range. Hovering reveals two icons in the top-left of every cell: a pie chart icon (open in Statistics for that range) and a list icon (open in History for that range). Cells with trades show those icons by default; empty cells show them only on hover.
- Period navigation — Use the header chevrons or scroll horizontally on the grid (trackpad / shift-scroll) to step to the previous/next period. The "next" arrow is disabled when you reach the current period.
- Cell text auto-sizes — The font size of metrics in each cell scales with the available cell height, so a 12-month year view stays readable and a single week with tall cells uses larger numerals.
- Customize what's shown — The gear icon opens the Calendar customizer to pick up to four metrics per cell and reorder them (see Customizing columns, cells and section order).
Statistics screen
The Statistics screen is the full analytics dashboard. It computes every metric in the Analytical statistics reference over the closed trades in the currently selected period and accounts, and renders them as a stack of sections — each can be toggled or reordered with the customizer.
Sections, in their default order:
- Hero KPIs — Net P&L, Profit factor, Max drawdown, Current streak.
- IPTRADE Score & equity curve — the proprietary 0-100 score (with letter grade, tier, and per-factor bars) alongside the cumulative P&L curve over time.
- Win rate & key ratios — win-rate gauge plus Expectancy, Avg W/L, Recovery, Sharpe, Sortino, Calmar, Day win rate, Best/Worst trade, Best/Worst day, Avg holding.
- Advanced metrics — Kelly %, SQN, Z-score, Stdev/trade, Profit/lot, Trades/day, Winners/day, Losers/day.
- Daily P&L — bar chart of net P&L per active trading day.
- Drawdown & distribution — drawdown curve from the equity peak plus a histogram of per-trade P&L.
- Trade duration — net P&L grouped by hold-time bucket (<1m, 1-15m, 15-60m, 1-4h, 4-24h, 1-7d, >1w).
- Time patterns — net P&L by weekday and hour of day (open time of the trade).
- Hour × weekday heatmap — a 7×24 matrix combining both axes.
- Long vs Short + Top symbols — long/short share gauge with side tiles, plus the top 10 symbols by net P&L.
- Bottom symbols + Volume mix — bottom 10 symbols by net P&L (only shown when more than 5 symbols traded) and a donut of trade share by symbol.
- Daily activity calendar — a Sunday→Saturday heatmap of the selected period.
- Costs footer — Total commission, Total swap, Avg win/loss holding time.
Cold-start renders show a full-page spinner; subsequent navigations rely on the header refresh icon as the loading indicator and keep the previous data visible while the new fetch runs.
History screen
The History screen lists every closed deal in the active period and selected accounts, in a sortable, customizable table.
- Columns (default order) — Account ID, Platform, Server, Nickname, Symbol, Side, Volume, Open, Open time, Close, Close time, SL, TP, Commission, Swap, PnL, Net PnL, Ticket.
- PnL is the platform's reported profit on the deal (before swap and commission netting in some platforms).
- Net PnL is the figure used by every analytical statistic — it is the deal's net result including commission and swap.
- Sorting — Click a column header to sort ascending; click again for descending; click a third time to clear the sort and return to default chronological ordering (most recent close first).
- Reorder columns — Drag the grip handle that appears on hover at the edge of any header. A blue indicator shows where the column will land. The new order persists.
- Toggle columns — Open the customizer (gear icon) to show/hide columns. Hidden columns keep their position so re-enabling them brings them back where they were.
- Period selection — Use the header date range picker (free-form) or the granularity navigation. Both apply to the same filter.
- Account filter — The same multi-select used by every other view. Select one or several accounts to scope the list, or "All accounts".
- Export CSV — Download the currently filtered table to a CSV file (file name includes the active period).
Analyze view (pivot table)
The Analyze view is a pivot table for cross-cutting analysis of your closed trades. It is the table that opens when you click the grid icon (the four-square icon) in the dashboards header. It can be opened from any of the other dashboards and toggling it again returns you to the previous view.
It answers questions like "How does my EURUSD P&L break down by weekday?", "What is my win rate by hour of day per account?", or "Where is my Kelly-positive behavior concentrated?" — by letting you drop any dimension on the rows, any other dimension on the columns, and pick the metric to compute in every cell.
- Pivot anatomy — The dimension picked as Rows becomes the row labels (left axis), the dimension picked as Columns becomes the column labels (top axis), and each cell is the metric computed over the trades that fall in that row × column intersection. The right column shows the row total, the bottom row shows the column total, and the bottom-right cell is the grand total.
- Dimensions available — No breakdown, Symbol, Side (long / short), Weekday, Hour of day, Month of year, Day of month, Duration (using the same buckets as the Statistics screen), Account (account nickname or ID), Platform (MT4 / MT5 / cTrader). Picking No breakdown on either axis collapses that axis to a single "Total" line, useful for one-dimensional reports.
- Metrics available — Net P&L, Trade count, Win rate %, Avg P&L per trade, Best trade, Worst trade, Volume, Profit factor, Expectancy. Signed metrics (P&L, expectancy, best/worst, avg) are colored green/red by intensity; unsigned metrics (count, win rate, volume, profit factor) use a neutral blue ramp scaled to the maximum cell value.
- Swap rows/columns — The arrow button between the row and column selectors flips the two axes in place, so you can quickly transpose the table without re-picking dimensions.
- Counters — The header shows total trades in scope, plus the number of rows and columns generated by the current pivot. If a combination produces no data, the table is replaced with a hint to widen the period or change dimensions.
- What it's used for — Spotting which symbols you trade well by side, finding hours of day with poor win rate, comparing accounts side by side, detecting whether a particular weekday or duration bucket carries most of your edge. It's the right tool whenever you suspect a subset of your trades is dragging the rest down (or carrying it).
- Persistence — The active row dimension, column dimension and metric are remembered locally; reopening the view keeps your last pivot.
The Analyze view inherits the period and account filter from the shared header (it does not use the granularity toggle — the date range picker is used instead).
Analytical statistics reference
This section is the source-of-truth reference for every metric IPTRADE Multi computes on the Statistics, Calendar, History and Analyze views. Use it to look up exactly how a number is built and how to interpret it.
Conventions used everywhere:
- "Net P&L" and "net" always refer to the deal's net profit including commission and swap (the Net PnL column in History). Gross figures are called out explicitly as "gross".
- All sums and averages are computed over closed deals (deals with a close time) inside the selected period for the selected accounts.
- Time-series metrics (Sharpe, Sortino, Calmar, daily averages) are aggregated per calendar day of trading activity.
How a trade counts (win / loss / break-even)
To filter out platform rounding noise, every metric uses a 0.005 epsilon when classifying a deal:
- Win — net P&L greater than +0.005.
- Loss — net P&L less than −0.005.
- Break-even — net P&L within ±0.005.
Break-even trades count toward Total trades and Total volume but do not count toward Wins, Losses, win rate or streaks.
IPTRADE Score
The IPTRADE Score is a proprietary 0-100 composite grade that summarizes the quality of your trading over the analysis window. It is shown on the Statistics dashboard as a big letter card (S / A / B / C / D / F), a numeric score, a descriptive tier, and a per-factor breakdown.
It is built from five factors, each scored 0-100 and combined with a fixed weight:
-
Profitability — weight 30%. Captures how much money the strategy makes per unit of risk taken. Combines two sub-scores:
- Profit factor sub-score (70% of the factor) = clamp((profitFactor − 1) / 1.5, 0..1) × 100. A profit factor of 1 scores 0 and 2.5 scores 100. Infinite profit factor (no losing trades) caps at 5 ⇒ 100.
- Expectancy sub-score (30% of the factor) = clamp(expectancy / max(avgWin, 1), 0..1) × 100 when expectancy is positive, otherwise 0.
-
Win quality — weight 20%. Combines win rate and average winner vs average loser.
- Win-rate sub-score (50%) = clamp((winRate% − 30) / 40, 0..1) × 100 — 30% scores 0, 70% scores 100.
- Avg W/L sub-score (50%) = clamp((avgWLRatio − 0.5) / 1.5, 0..1) × 100 — ratio 0.5 scores 0, ratio 2 scores 100.
-
Risk control — weight 20%. Penalizes deep drawdowns and rewards quick recoveries.
- Max DD sub-score (60%) = clamp(1 − maxDDPct / 40, 0..1) × 100 — 0% drawdown scores 100, 40% scores 0.
- Recovery factor sub-score (40%) = clamp(recoveryFactor / 5, 0..1) × 100 — recovery factor 5 scores 100.
-
Consistency — weight 15%. Inverse of the coefficient of variation of daily P&L: cv = |stdevDaily / avgDailyPnl|, score = clamp(1 − min(cv, 5) / 5, 0..1) × 100. Lower day-to-day variance vs daily expectancy ⇒ higher score.
-
Edge strength — weight 15%. Built on the SQN (System Quality Number, see below). clamp((sqn + 0.5) / 2.7, 0..1) × 100 — SQN of 1.7 (Van Tharp's "good" threshold) scores 80; SQN of 2.2 scores 100.
The total is the weighted sum of the five factors. The grade and tier are derived from the total:
| Total | Grade | Tier |
|---|---|---|
| ≥ 90 | S | Top-tier edge |
| ≥ 75 | A | Excellent |
| ≥ 60 | B | Solid |
| ≥ 45 | C | Average |
| ≥ 30 | D | Below average |
| < 30 | F | No edge yet |
The score reacts to the active period and account filter, so changing the date range or selecting a single account re-computes a fresh grade for that scope.
Profit & loss (P&L)
- Net P&L = sum of net_profit across all closed deals in the selection. Already includes commission and swap.
- Gross profit = sum of net_profit for winning deals only (net > +0.005).
- Gross loss = sum of |net_profit| for losing deals only (net < −0.005). Reported as a positive number for display.
- Best trade = the single largest net_profit value across deals.
- Worst trade = the single smallest (most negative) net_profit value.
- Expectancy = Net P&L / Total trades. Expected net P&L per trade — your edge expressed in money terms.
- Profit factor = Gross profit / Gross loss. ≥ 1 means winners cover losers; ≥ 2 is generally considered strong. Reported as ∞ when there are no losing trades.
Win-rate metrics
- Total trades — count of all closed deals (wins + losses + break-even).
- Wins / Losses / Break-even — counts using the ±0.005 classification.
- Win rate % = Wins / Total trades × 100. Note: break-even trades remain in the denominator, so a portfolio with many break-even trades will show a lower win rate than one that filters them out.
- Avg win = Gross profit / Wins. Average money made per winning trade.
- Avg loss = Gross loss / Losses. Average money lost per losing trade (positive number).
- Avg W/L ratio = Avg win / Avg loss. Reported as ∞ when there are no losing trades.
Risk-adjusted ratios
These metrics aggregate per-day net P&L (Daily bucket = sum of all closed deals on that calendar day) and assume 252 trading days per year for annualization (the same convention TradingView, MT5 and most trading-stat tools use).
- Avg daily P&L = Sum of daily P&L / Number of active trading days.
- Stdev daily = population standard deviation of the daily P&L series.
- Sharpe = (Avg daily P&L / Stdev daily) × √252. Risk-adjusted return: how many units of average return you get per unit of volatility, annualized. Sharpe ≥ 1 is considered acceptable; ≥ 2 strong.
- Sortino = (Avg daily P&L / Downside stdev) × √252. Same idea as Sharpe but the volatility term only counts negative-day deviations (it does not penalize upside surprise). Generally higher than Sharpe; the gap between them measures how asymmetric your returns are.
- Calmar = Annual return / Max drawdown where annual return = Avg daily P&L × 252. How many "max drawdowns" worth of profit you generate per year.
- Recovery factor = Net P&L / Max drawdown. How many times your worst drawdown the period's net profit covers. ≥ 5 is typically considered strong.
Drawdown
The equity curve is the cumulative net P&L over time, sampled at every closed trade.
- Max drawdown — the largest peak-to-trough decline in the equity curve, in money terms. Computed by walking the curve, tracking the running peak, and recording the deepest trough below that peak.
- Max drawdown % = Max drawdown / Peak value at the start of that drawdown × 100. Useful when comparing across accounts of different sizes.
- Max drawdown duration — time elapsed from the peak that started the drawdown to the trough where it bottomed (formatted as days/hours/minutes).
- Avg drawdown — average size of the drawdown across every point of the equity curve where the curve was below its running peak.
Edge & advanced metrics
- Kelly % = (p − (1 − p) / b) × 100 where p = winRate (0..1) and b = avgWin / avgLoss. The fraction of capital that a Kelly bettor would risk per trade for log-optimal growth. Negative values mean don't bet at all. Capped at ±100% in the UI. When avgLoss is zero (no losing trades yet), Kelly defaults to the win rate. Most practitioners trade fractional Kelly (e.g. ½ or ¼ Kelly) to reduce variance.
- SQN (System Quality Number) = √N × Expectancy / Stdev per trade, where N is the total trade count and stdev is over per-trade net_profit. Van Tharp's bracketing: < 1.0 below average, 1.0–1.7 average, 1.7–2.5 good, 2.5–5.0 excellent, ≥ 5.0 super system. SQN combines edge, consistency and sample size into one number.
- Stdev / trade — sample standard deviation of net_profit across closed deals. A direct read on per-trade risk.
- Profit / lot = Net P&L / Total volume traded. Money made per unit of size — efficiency per unit of risk taken. Useful for comparing different position-sizing approaches.
- Trades / day, Winners / day, Losers / day — average per active trading day. Helps gauge activity level and how often the strategy fires.
Streaks and Z-score
- Current streak — the length of the active run of consecutive wins or losses, ending at the most recent decided trade. Reported with W/L suffix and sign-tinted (green for win streak, red for loss streak).
- Max consecutive wins / losses — longest run of either direction observed in the period.
- Z-score (of streaks) — Wald-Wolfowitz runs test on the W/L sequence. Tests whether wins and losses alternate randomly:
- |Z| < 1.96 ⇒ the sequence looks like random alternation (no clustering signal).
- Z < −2 ⇒ statistically significant clustering — your wins and losses come in streaks (use larger position sizing after a loss to capture the reversion, or smaller after a win to protect gains, depending on which streak direction dominates).
- Z > +2 ⇒ statistically significant alternation — wins and losses tend to flip more than chance would predict.
Daily and per-period metrics
Many sections aggregate trades into daily buckets (calendar day, local time):
- Total days — count of distinct calendar days with at least one closed trade.
- Positive days / Negative days — days whose net is > +0.005 or < −0.005.
- Day win rate = Positive days / Total days × 100.
- Best day / Worst day — the single calendar day with the highest / lowest net P&L (with the date shown as a hint).
The same buckets feed the daily P&L bar chart, the daily activity heatmap (Sunday→Saturday calendar of the selected period) and the time-pattern charts (by weekday, by hour of day, and a 7×24 hour-by-weekday heatmap).
Costs and holding times
- Total commission — sum of commission across closed deals in the selection.
- Total swap — sum of swap (overnight financing) across closed deals.
- Avg holding — average time between open and close, computed only over deals where close time is after open time.
- Avg win holding — same average, restricted to winning trades.
- Avg loss holding — same average, restricted to losing trades. A pattern where loss holding ≫ win holding is a textbook "let losers run, cut winners short" warning sign.
The Statistics screen also groups trades into duration buckets so you can see net P&L by hold-time band. Buckets used everywhere (Statistics, Analyze, Calendar duration breakdowns):
< 1m, 1-15m, 15-60m, 1-4h, 4-24h, 1-7d, > 1w.
Long vs Short and symbol breakdowns
- Long trades / Short trades — counts by side (buy = long, sell = short).
- Long net / Short net — sum of net_profit per side.
- Long win rate / Short win rate = wins on that side / total trades on that side × 100.
- Long share / Short share — percentage of total trades placed on each side. The donut gauge in the Statistics screen visualizes this.
For symbols, the Statistics dashboard renders:
- Top symbols — top 10 by net P&L (descending).
- Bottom symbols — bottom 10 by net P&L (ascending), only shown when more than 5 distinct symbols were traded.
- Volume distribution — donut by trade count, top 8 + an "Other" bucket.
Per-symbol stats include net P&L, total trades, wins, losses, win rate and total volume.
Calendar cell metrics
The Calendar shows up to four of these metrics per cell, in the order you choose. The first visible metric is rendered as the headline (large) value:
- Net P&L — sum of net P&L for the day/week/month. Default headline. Tinted green when positive, red when negative.
- Trade count — number of trades closed in the cell. Default secondary metric.
- Win rate — wins / (wins + losses) × 100 for the cell. Tinted green ≥ 60%, amber 45-60%, red < 45%.
- Best trade — single best net_profit in the cell.
- Worst trade — single worst net_profit in the cell.
- Volume — total lots / contracts traded in the cell.
- Avg P&L per trade — net / trade count for the cell, signed.
Compact-number formatting is used in calendar cells, so figures like 12,450 render as 12.5K to fit small cells.
Analyze view dimensions and metrics
The Analyze pivot uses the same metrics as the rest of the dashboards, but evaluates them on whatever (rows × columns) breakdown you pick. The dimensions and the metrics:
- Dimensions — No breakdown (collapses an axis to a single "Total" bucket), Symbol, Side (long / short), Weekday, Hour of day, Month of year, Day of month, Duration (same buckets as above), Account (account nickname or ID), Platform.
- Metrics —
- Net P&L — sum of net_profit. Signed (green/red coloring).
- Trade count — number of trades.
- Win rate % — wins / decided trades × 100.
- Avg P&L per trade — net / trades. Signed.
- Best trade / Worst trade — extreme net_profit values. Signed.
- Volume — total lots / contracts.
- Profit factor — gross win / gross loss within the cell. Reported as ∞ when no losing trades.
- Expectancy — net / trades. Same value as Avg P&L per trade in the pivot's accumulator; kept separate because the meaning differs (one is a descriptive average, the other an edge metric).
Cells with no trades display —. Row totals, column totals and the grand total are computed independently per row/column from the underlying deals (so a profit factor row total is not the average of its cell profit factors — it's the row's own gross-win / gross-loss).
Troubleshooting
Connections fail (Offline / no updates)
- Turn Copy Engine OFF then ON (global toggle).
- Close and reopen IPTRADE Multi.
- If still failing: remove all accounts, reconnect, and reconfigure Master/Slaves.
Sleep / suspend
When the computer sleeps, network and bots can drop; accounts may go Offline. Prefer disabling sleep while running IPTRADE, or use a Windows VPS for 24/7. After wake, wait a bit for reconnect; if not, use the steps above.
cTrader symbol name missing
Some cTrader brokers don’t expose a reliable symbol name in the feed. Without it, IPTRADE can’t safely translate or match the instrument and the slave may not copy. Prefer instruments with consistent symbol IDs, use Symbol translation when you know the mapping, or accept that some symbols may not be copyable.
Still can’t fix it? Contact us with your logs
If none of the steps above resolve your issue, please reach out to us so we can take a look. To help us diagnose the problem quickly:
- Open the Logs screen in IPTRADE Multi.
- Click Download logs to save the logs CSV to your machine.
- Send us that CSV file together with a short description of what you were doing when the issue happened.
You can share it via any of the channels listed in the Support section below — Instagram DM or email work best for attaching the file.
FAQ
What is IPTRADE?
IPTRADE has one product: IPTRADE Multi. It’s the local trade copier for Windows and macOS—cross-platform copying (MT4, MT5, cTrader) with full configuration. Everything runs on your machine. On macOS, cTrader is supported.
How does IPTRADE work?
You set one account as Master (source) and others as Slaves (copiers). Trades are replicated in real time with zero added latency (TCP on your machine). IPTRADE Multi runs on your computer—all processing is local, with one IP for all accounts and no data sent to external servers.
Is IPTRADE safe for prop firms?
IPTRADE is designed for single-IP use: all accounts use the same IP, processing is local, and there is no data exposure to external servers. That helps you meet typical IP restrictions that prop firms enforce. Other prop firm rules (copy trading, EAs, limits, etc.) vary by firm—you must read each firm’s terms and do your own research.
Can I copy trades across different platforms?
Yes. With IPTRADE Multi you can copy between MetaTrader 4, MetaTrader 5, and cTrader, across different brokers. Symbol translation, prefix/suffix, and lot size are handled automatically.
What are the system requirements?
Windows 10/11 64-bit or macOS Apple Silicon ARM64, 8 GB RAM minimum, 2 GB free disk space, stable internet. The app is lightweight and runs on most modern machines.
Which trading platforms are compatible?
Windows: MT4, MT5, cTrader. macOS: cTrader.
Can I use IPTRADE on Mac?
Yes. IPTRADE Multi supports macOS Apple Silicon ARM64 with cTrader. MetaTrader 4 and MetaTrader 5 require Windows 64-bit (PC or Windows VPS) because they use the MetaTrader terminal and Expert Advisor integration.
Why does my IP change when I switch Wi‑Fi / networks?
IPTRADE runs on your machine, so accounts use the public IP of the network you’re on. Changing Wi‑Fi or location changes that IP. For a stable IP (e.g. for prop firms), use one network consistently or run IPTRADE on a Windows VPS.
Why do my cTrader accounts show a different ID?
cTrader can use several identifiers (broker login, account number, internal API ID). IPTRADE may show the one used for routing copy events, which can differ from your broker portal. Use a Nickname in IPTRADE and confirm by platform, broker, and balance/equity.
Is my data private and secure?
Yes. All copying is local. No trade or account data is stored on external servers; your strategies and history stay on your side. Zero exposure to third parties.
How many accounts can I connect?
Unlimited. Connect as many master and slave accounts as you need with full configuration—no caps, no per-account fees. IPTRADE is 100% free for everyone.
Is IPTRADE really free?
Yes. IPTRADE Multi is 100% free—no trials, no caps, no hidden costs. Download it, run it on your machine, and copy unlimited accounts.
Why is IPTRADE free?
Honestly, to give back to the community. We built IPTRADE for ourselves first, after trying paid copiers that felt opaque or overpriced for what they actually delivered. Once it worked well, releasing it openly felt like the right call—our way of showing this space isn't only paywalls and recurring fees, and that there's room for serious tools built by traders, for traders. We cover our own infrastructure and updates; no trials, no upsell, no catch.
How difficult is the installation?
Setup usually takes about 5 minutes. You install the app and then the bots on your platforms. The process is guided.
Can I use IPTRADE on a VPS?
Yes. You can run IPTRADE Multi on a Windows VPS for 24/7 operation. Recommended if you don’t want to keep your PC on all the time.
What's the latency and speed?
Zero added latency. Communication between the app and platforms uses TCP on your machine, so there’s no round-trip to external servers. Trades are replicated as fast as your platform and broker allow.
What does IPTRADE Multi include?
Full local trade copying: MT4, MT5, and cTrader support, symbol translation, prefix/suffix, multiplier and fixed lot, reverse trading, and one IP for all accounts. Designed for single-IP use (e.g. prop firm IP restrictions); verify each firm’s terms. Suitable for any multi-account setup.
Support
- Instagram DM: [@iptradecopier](https://www.instagram.com/_iptrade
- Founder (direct): joaquinmetayer@gmail.com
- Website: iptradecopier.com
Founder: Joaquin Metayer — Founder — LinkedIn